
Follow the Pound
Where your taxes go before they reach a bin lorry, a school, or a pot hole.


With the May 7th elections looming there’s a lot of noise about each party’s national policies, including hatchet jobs and scaremongering from all sides, most of which has little to do with local councils.
Every time public services deteriorate while taxes rise, the same question gets asked but are never properly answered: where is the money going?
Here are the facts.
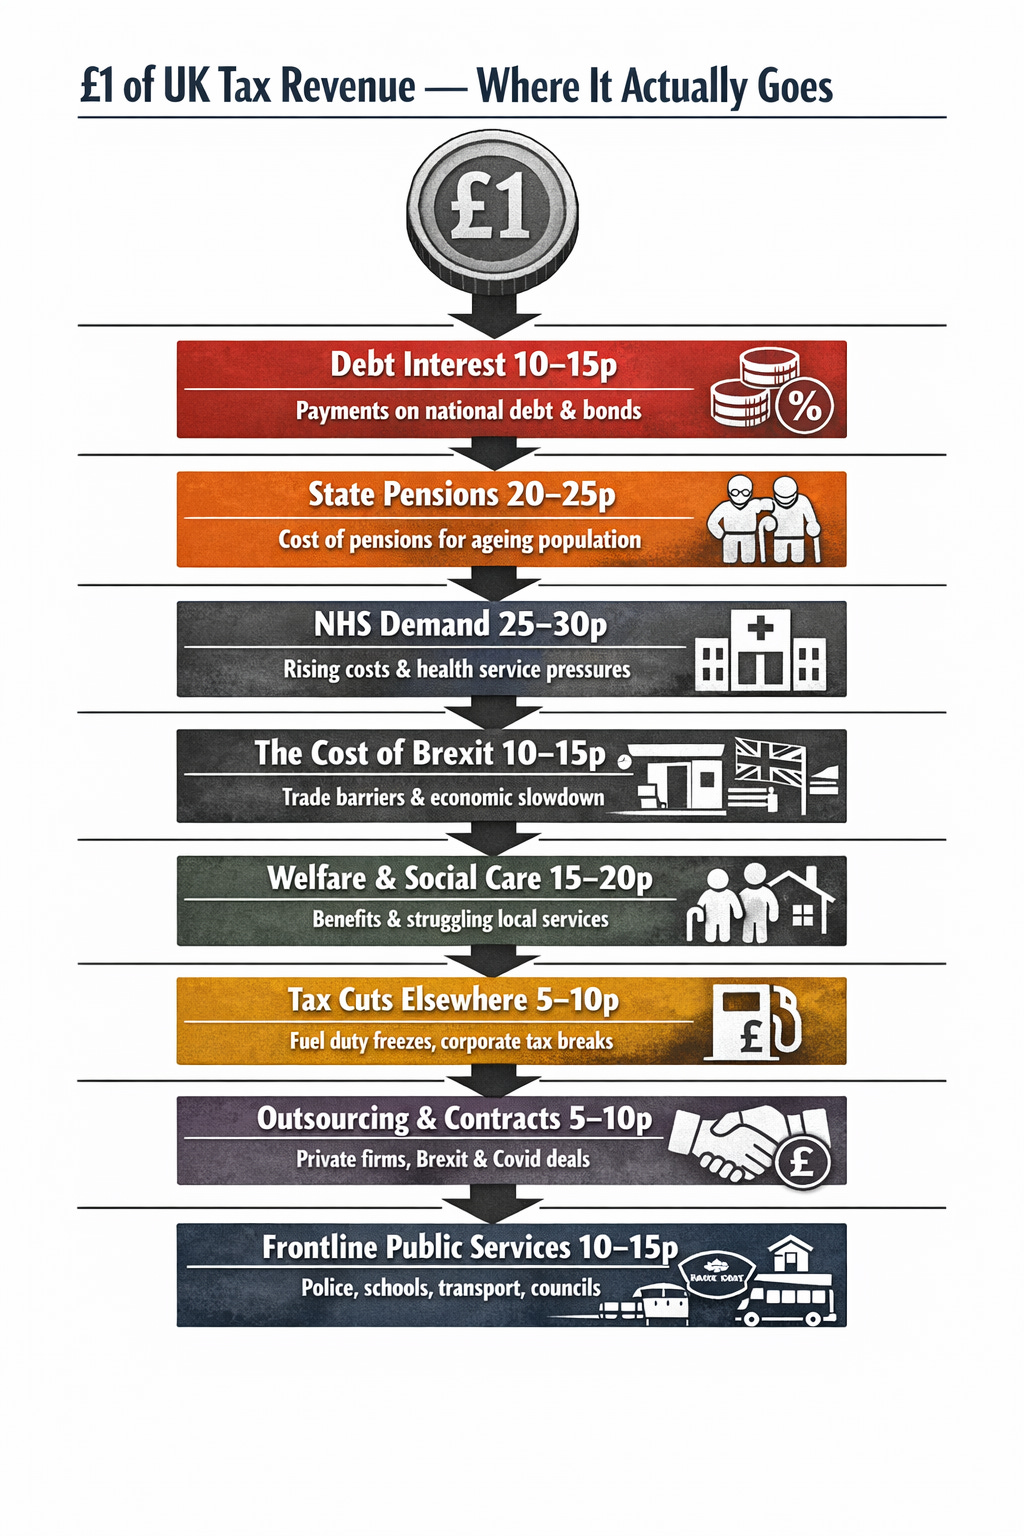
Note on the diagram: the figures shown are illustrative ranges based on the best available public spending data. That the slices add up to more than £1 at their upper limits is not an error, rather it reflects the reality that the claims on every pound of tax revenue, combined, exceed what is collected. Frontline services receive what remains after the other claims are met.
What comes in
The UK government collects around £1.1 trillion a year in taxes via income tax, national insurance, VAT, corporation tax, and the rest. Council tax adds roughly £40bn more, collected locally.
Before a single teacher is paid, a pothole filled or a hospital appointment kept, significant portions of that money are already spoken for.
The first claim on your taxes: debt interest
The single largest non-negotiable outgoing is debt interest — the cost of servicing what the government has previously borrowed.
In 2022-23 it exceeded £100bn for the first time, reaching £120bn, a post-war record, equivalent to 10.8% of all government revenue. The OBR’s current forecast puts it at £111bn in 2025-26, representing 8.3% of total public spending. (OBR, March 2024 Economic and Fiscal Outlook; OBR debt interest page, updated 2025.)
For context: the entire schools budget for England runs to roughly £60bn. Debt interest costs roughly twice that before a lesson is taught.
The decisions that created this debt were made by identifiable governments at identifiable moments. Emergency borrowing after the 2008 financial crash was the Labour government responding to a global banking failure originating in the private sector. Debt continued rising through the 2010s under the Coalition and Conservative governments, not because borrowing increased sharply but because the growth forecast to service existing debt did not materialise. Covid required another borrowing surge in 2020-21 under the Johnson government, responding to a genuine emergency, albeit not in genuine ways. Then in 2022-23, interest payments tripled, which requires a separate explanation.
Why debt interest tripled
The UK holds an unusually high proportion of inflation-linked government bonds, called index-linked gilts. As of December 2025, 25.2% of UK wholesale debt is index-linked, which is roughly twice the proportion of the next highest G7 country. (DMO, Debt Management Report 2026-27.)
That structure means when inflation rises, debt servicing costs rise automatically and immediately. The OBR’s own figures show a 1 percentage point rise in RPI increases debt interest payments by £5.9bn in the same year. When RPI hit a 40-year high in 2022-23, payments tripled. (OBR, March 2024 EFO sensitivity box.)
Our inference: Brexit contributed to the inflationary conditions of 2021-23 through trade friction, labour market tightening, and a weaker pound raising import costs. The OBR does not isolate Brexit as the primary cause of that inflation spike, instead they attribute it primarily to global energy prices and supply chain disruption, but Brexit’s structural effects were running concurrently: a smaller economy, importing the same goods at higher cost through a weaker currency. No single mainstream news media source makes the full causal chain explicit. We are connecting confirmed OBR components, not citing a single document.
What is not inference is that the OBR has confirmed, and re-confirmed in 2023 and 2024, that Brexit reduces UK long-run productivity by 4% relative to remaining in the EU, reflecting increased non-tariff barriers on UK-EU trade. (OBR Brexit analysis page; OBR March 2023 EFO box.) In an economy the size of the UK’s, a 4% long-run productivity reduction translates to roughly £100bn in lost annual output. That is a derived calculation from the OBR figure, labelled as such.
The second claim on your taxes: a decade of spending reductions
Between 2009-10 and 2016-17, real-terms departmental spending per person fell from £6,460 to £5,460, a reduction of £1,000 per person. (IFS, Briefing Note 166, 2017.) By 2022-23, spending outside the Department of Health was still 21% lower per person in real terms than in 2010-11. (IFS, October 2022.)
These are measured outturns, rather than projections.
Those decisions were made by the Coalition government from 2010 and continued by successive Conservative governments. The stated rationale was reducing the deficit inherited from Labour. Whether that rationale was correct is contested, while the spending reductions are not.
Basically, two major financial reports show how government decisions significantly cut welfare spending:
2010–2016: The Institute for Fiscal Studies (IFS) found that policy changes alone (ignoring things like an ageing population) cut spending by £16.7 billion.
2016–2021: The Office for Budget Responsibility (OBR) estimated that further Conservative policies cut another £11.8 billion.
What you get if you vote for each party
These are the economic directions each party has set out. The independent assessments noted are from the IFS, OBR, or Resolution Foundation unless otherwise stated.
Conservatives: Lower taxes and tighter spending — independent analysts assess this as meaning real-terms reductions to most unprotected public services.
Labour: Fiscal rules held broadly steady, limited new spending, slow incremental improvement to services — no major structural change to the spending envelope in the short term.
Liberal Democrats: Higher taxes on wealthier households and investment income, directed at NHS, social care, and housing — independently assessed as more fully costed than most party platforms.
Green Party: Large-scale public investment and green infrastructure funded by substantial tax increases on high earners and wealth — the most ambitious spending platform on offer; independent costing is partial.
Reform UK: Large income tax cuts and reduced regulation, funded by the party’s claim of eliminating government waste — the IFS and independent analysts have found the arithmetic does not currently add up without significant additional borrowing or cuts not yet specified.
SNP (Scotland only): Higher devolved social spending and alignment with EU single market standards — long-term economic prospectus tied to Scottish independence, which remains unresolved.
Independents: No unified platform — local track record and stated priorities are the only available basis for assessment.
Note on this section: these summaries describe what each party’s published position implies in practice. They are not endorsements. Voters in England will not see SNP on their ballot paper. Reform UK, the Greens, and independent candidates have variable local election coverage so check your specific ballot.
What this means when you vote on May 7th
Most of what we can see deteriorating, such as libraries, children’s services, social care, road surfaces, etc is delivered by local government.
Local authorities cannot borrow for day-to-day spending. They cannot print money or run deficits. When central government reduces grant funding, which it did substantially after 2010, councils either raise council tax, cut services, or both.
Voting on May 7th means voting for who runs your local council - what to prioritise within the available budget, how contracts are managed and how planning decisions are made. All are consequential choices that affect everyone’s daily life.
The problem is the budget envelope itself is set in Westminster. Councils cannot resolve a £111bn annual debt interest bill, they cannot reverse a decade of real-terms spending reductions and they cannot undo a structural productivity loss that the OBR has confirmed three times.
The local ballot paper does not contain the decisions that created the constraints but it does gives voters a chance to decide who manages them.
What to Watch
The most important thing to watch is whether any party canvassing before May 7th acknowledges the structural ceiling on council spending or campaigns as if councils hold powers they do not have. We recommend you check your local candidates campaign promises against their party’s actual stated policies and the party’s previous voting records on the subject as recorded on theyworkforyou.com.
We understand that, for many, there is no one political party that can deliver everything people need as well as want. Our recommendation is to use available online resources that help you chooses your voting direction in the broader sense by policy rather than party in the first instance, using sites such as I Side With or Vote Compass. This should also give you a clear indication of who you do not want running your local council, which may mean you’re best bet is to vote tactically. Online resources for your area are available, such as whocanivotefor.co.uk. We also reccommend you vet your candidates for yourself as best you can as it seems the parties don’t always do their due diligence.